Visual Studio Code(VS Code) is a great text editor that can used to debug Node, C#.NET, TypeScript and thanks to its extensions and marketplace many more! I've been using VS Code since it came out for debugging JavaScript and later .NET Core but recently I as I was developing my website which at the time of writing is a WordPress site. I decided to try it out for debugging PHP. I was ready for pain after my experience setting up XDebug and PHP development on Apache with other IDEs but VS Code makes it a dream! Follow along to learn how to do this yourself.
Note: This tutorial is assuming that you already have a a WordPress install running on your and Visual Studio Code installed
Since the WordPress application code is running in Apache and we're not launching it using Visual Studio Code itself we need to 'attach' the debugger to the PHP process. This is done using Xdebug a "PHP extension for powerful debugging".
Install XDebug
The best way to install XDebug is by following these steps to use their custom installation wizard:
Note: There are other ways of getting the phpinfo() output but the vary on different server configurations. If you know a way that is easier on your machine then you can skip to step 3.
-
Create a file
phpinfo.phpin you htdocs or other apache accessible directory with the following content:<?php phpinfo(); ?> -
Open the file in a browser (for example http://localhost/phpinfo.php) then copy and paste the text by pressing (Ctrl/Command + A) (Ctrl/Command + C).
-
In the text box paste in the
phpinfo()output from the clipboard -
Click Analyse my phpinfo() output
-
Follow the instructions that are output. They should look something like this:

Configuring VS Code
To debug PHP in VS Code you need to install the PHP Debug extention here. Once you've done this follow these steps:
- Open the root of your WordPress installation in VS Code
- Press F5
Note: This will prompt you to select a language
- Select PHP
Debugging WordPress
Completing these steps will create a file in your workspace .vscode/launch.json here is mine as of posting this:
{"version": "0.2.0","configurations": [{"name": "Listen for XDebug","type": "php","request": "launch","port": 9000},{"name": "Launch currently open script","type": "php","request": "launch","program": "${file}","cwd": "${fileDirname}","port": 9000}]}
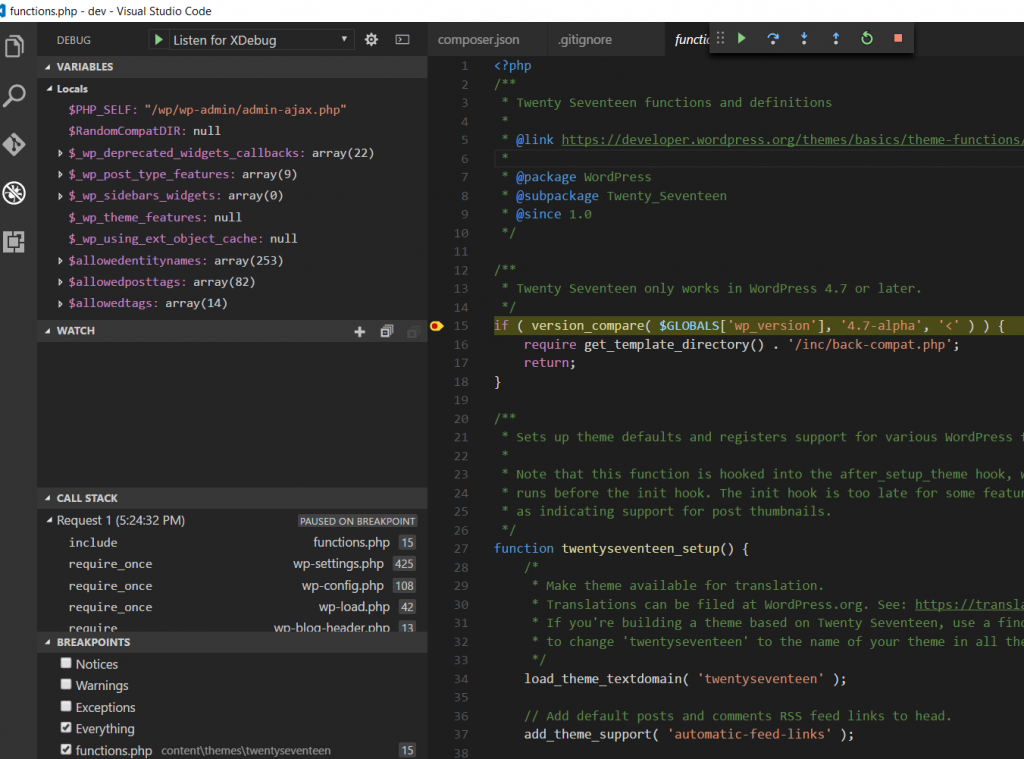
Now you create breakpoints in can press F5 and VS Code will attach to XDebug and will stop on breakpoints. For example in the following screenshot I have put a breakpoint in the functions.php in the twentyseventeen default WordPress theme.

Giving you a fully featured debugging experience in PHP!